The recently-published (seventh) edition of the annual DOE report highlights the key trends and important new developments from the past 12 months. An essential snapshot of the industry – which also informs the sector’s growth for the coming year – we’re delighted to present an exclusive extract.
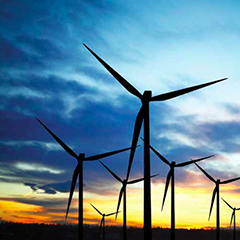
Annual wind power capacity additions in the United States achieved record levels last year, motivated by the then-planned expiration of federal tax incentives and impressive recent improvements in the cost and performance of wind power technology. At the same time, even with a short-term extension of federal tax incentives now in place, the U.S. wind power industry is facing uncertain times. It will take time to rebuild the project pipeline, ensuring a slow year for new capacity additions.
Continued low natural gas prices, modest electricity demand growth, and limited near-term demand from state Renewables Portfolio Standards (RPS) have also put a damper on industry growth expectations. In combination with global competition within the sector, these trends continue to impact the manufacturing supply chain. What these trends mean for the medium to longer term remains to be seen and will be dictated in part by future natural gas prices, fossil plant retirements, and state and federal policy decisions, although recent declines in wind energy prices have boosted future growth prospects.
This annual report – now in its seventh year – provides a detailed overview of developments and trends in the U.S. wind power market, with a particular focus on 2012.
Top line findings
Wind power additions hit a new record in 2012, with 13.1 GW of new capacity added in the United States and $25 billion invested. Wind power installations in 2012 were more than 90% higher than in 2011 and 30% greater than the previous record in 2009. Cumulative wind power capacity grew by 28% in 2012, bringing the total to 60 GW.
Wind Power Represented the Largest Source of U.S. Electric-Generating Capacity Additions in 2012. Wind power constituted 43% of all nameplate capacity additions in 2012, overtaking natural gas-fired generation as the leading source of new capacity. This follows the five previous years in which wind power represented between 25% and 43% of new U.S. electric generation capacity in each year.
The United States narrowly regained the lead in annual wind power capacity additions in 2012 but was well behind the market leaders in wind energy penetration. After leading the world in annual wind power additions from 2005 through 2008, and then losing the mantle to China from 2009 through 2011, the U.S. narrowly regained the global lead in 2012. The U.S. market represented roughly 29% of global installed capacity in 2012, a steep rise from the 16% registered in 2011. In terms of cumulative capacity, the U.S. remained the second leading market. A number of countries are beginning to achieve high levels of wind energy penetration: end-of-2012 installed wind power is estimated to supply the equivalent of nearly 30% of Denmark’s electricity demand, compared to approximately 18% for Portugal and Spain, 16% for Ireland, and 10% for Germany. In the United States, the cumulative wind power capacity installed at the end of 2012 is estimated, in an average year, to equate to roughly 4.4% of electricity demand.