New Berkeley Lab study quantifies solar and wind costs in relation to wholesale market costs, suggests that purchasers should in some cases rethink contracting practices.
Since solar and wind power are not tied to the vagaries of fuel markets, their steady prices can serve as a hedge against wholesale power price fluctuations. As wind and solar grow to become a more significant factor in energy markets, it raises the question of who benefits from this potential price hedge, and how or whether it is influencing consumer electricity bills.
Drawing upon a vast amount of plant-level empirical data from 1,437 large-scale projects, a new Berkeley Lab study quantifies the “net market value” of wind and solar over time. Net market value (net value, for short) is defined as the difference between the cost of replacing solar and wind generation by purchasing electricity in wholesale markets and the levelized cost of solar and wind electricity (LCOE). A positive value means possible power-sector cost savings, a negative value the opposite. The study further explores the factors that influence whether this potential net value is passed on to end-use consumers through their electricity bills.
Learn more: https://emp.lbl.gov/publications/grid-value-and-cost-utility-scale
Key findings of the new study include:
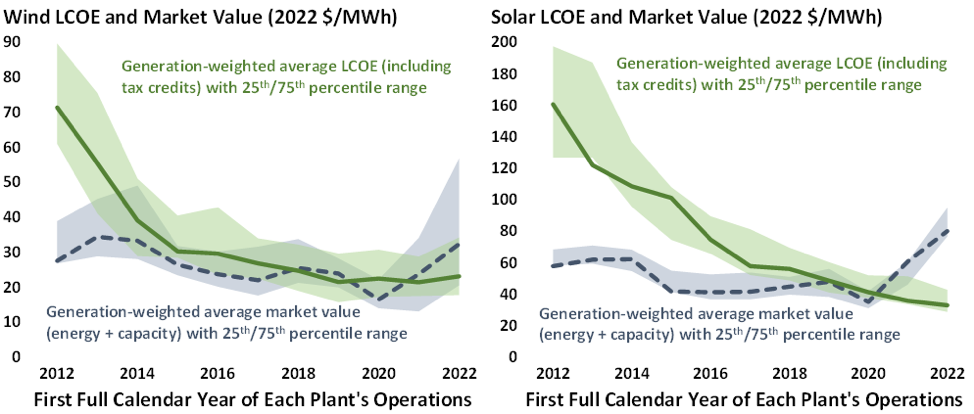
Wind and solar economics have improved over time. On average, wind and solar costs (after federal tax credits) have been roughly in-line with market replacement costs (or equivalently ‘market value’) since 2018 or 2019. The figure below shows the national average LCOE (green) and market value (blue) of wind (left) and solar (right), by plant vintage. Market value is the energy value from hourly marginal electricity prices, plus the capacity value based on capacity credit rules and prices. Improvement in the “net value” among more recent plant vintages is primarily due to declines in the levelized cost of wind and solar, coupled with an uptick in replacement costs in 2021 and especially 2022. In 2021 and 2022, on a national basis, new power purchasers typically paid less for wind or solar than it was worth in wholesale markets—a positive net value, meaning savings for purchasers and potentially enabling consumer electricity bill reductions. Before 2018, on the other hand, net value was generally negative, as most projects required supplemental support from state policies given higher LCOEs.
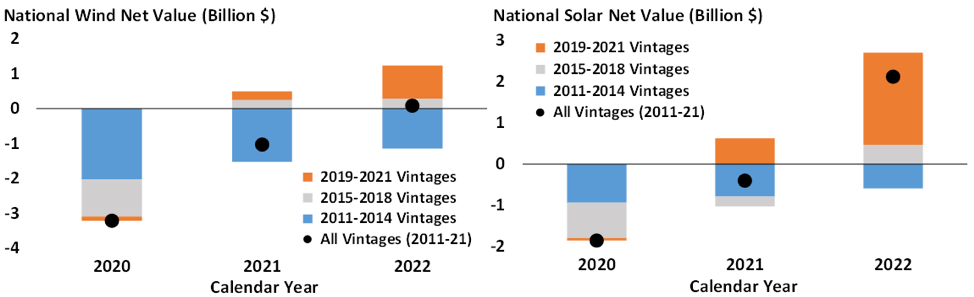
Consumer electric bill savings and hedge value are possible. Considering all plants within the study sample (those built from 2011 through 2021), net value has generally increased over time. The figure below presents the national net value of wind (left) and solar (right) in dollar terms for calendar years 2020 through 2022, by plant vintage cohort. In 2022, solar generated $2.1 billion in net value nationwide, while wind generated $100 million. Net costs in previous years were primarily due to the dominance of higher-cost early wind and solar projects, many of which were also supported through state-level policies intended, in part, to motivate cost reductions. Considerable regional diversity exists in the results, as shown in the full study.
Whether end-use customers benefit via lower electricity bills and hedge value is influenced by contractual structures and sophistication. With solar and wind increasingly competitive as bulk power assets, the question of “who benefits” is becoming more important. In the case of regulated and public utilities, any savings (or costs) from owned or contracted generation tend to pass through to end-use customers. The same is often true with voluntary customer purchases of green power when power purchase agreements (PPAs) are used. On the other hand, contracts that fix prices for unbundled renewable energy certificates (REC) do not offer the same potential value for customers. In some cases, this is causing purchasers to rethink their contracting practices to capture more of the rising net value of wind and solar power.
It will be important to track net value into the future. Wholesale power prices are decidedly lower now than in 2022 and solar and wind are beginning to saturate some markets. Yet the cost of wind and solar can be expected to decline as supply chain pressures ease, the new tax credit provisions in the Inflation Reduction Act take full effect, and technology continues to advance.
Beyond the analytical results, the study illustrates the diversity of impacts of past wind and solar deployment on consumer electricity bills, through various case studies of utility procurement, state policies, and voluntary customer demand.
Though the study focuses on the direct drivers of costs in power markets, which determine development and purchase decisions, it also lists broader cost and value impacts that are out of scope of this work. As one example of some of these broader impacts, recent Berkeley Lab research shows that the health and climate benefits of wind and solar equaled $74 billion in 2022.
The study, “Grid Value and Cost of Utility-Scale Wind and Solar: Potential Implications for Customer Electricity Bills”, is available at: https://emp.lbl.gov/publications/grid-value-and-cost-utility-scale.
This work was supported by the U.S. Department of Energy’s Office of Energy Efficiency and Renewable Energy, in particular the Solar Energy Technologies Office and Wind Energy Technologies Office.