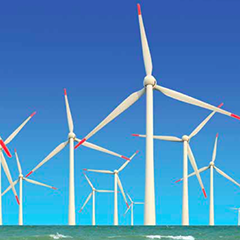
The offshore wind industry is transitioning from early development to demonstration of commercial viability. Worldwide, there are an increasing number of commercial-scale projects in operation, while in the US there are concrete plans afoot to follow the lead of Europe and elsewhere. We take a look at the Department of Energy’s very latest market assessment.
There are approximately seven gigawatts (GW) of offshore wind installed worldwide. The majority of this activity continues to centre on northwestern Europe, but development in China is progressing as well. In 2013, more than 1,700 megawatts (MW) of wind power capacity was added globally, with the United Kingdom alone accounting for 812 MW (47%) of new capacity. In total, capacity additions in 2013 showed a roughly 50 percent increase over 2012, finally surpassing the pace of installations achieved in 2010.
It appears that near-term growth will continue, with more than 6,600 MW of offshore wind under construction in 29 projects globally, including 1,000 MW in China. While this upward trend is encouraging, uncertain political support for offshore wind in European nations and the challenges of bringing down costs means that the pace of capacity growth may level off in the next two years.
On the demonstration project front, the DOE announced continued funding for Offshore Wind Advanced Technology Demonstration (ATD) to three projects in May 2014. Fishermen’s Energy, Dominion, and Principle Power were each selected for up to $46.7 million in federal funds for final design and construction of pilot projects off New Jersey, Virginia and Oregon, respectively, from an original group of seven projects that were selected in 2012.
Two of the other original seven, the University of Maine and the Lake Erie Economic Development Company of Ohio, will receive a few million each, under separate awards, to continue the engineering designs of their proposed pilot projects.
Overall, offshore wind power project costs may be stabilizing somewhat compared to their recent upward trend. Notably, for those projects installed in 2013 for which data were available, the average reported capital cost was $5,187/kW, compared to $5,385/kW for projects completed in 2012.
While it appears that the stabilizing trend may continue for projects completed in 2014, a lack of data for projects anticipated to reach completion in 2015 and 2016 makes it difficult to assess whether the trend will continue. Note that all such capital cost data are self-reported by project developers and are not available for all projects globally; therefore, it may not be fully representative of market trends.


