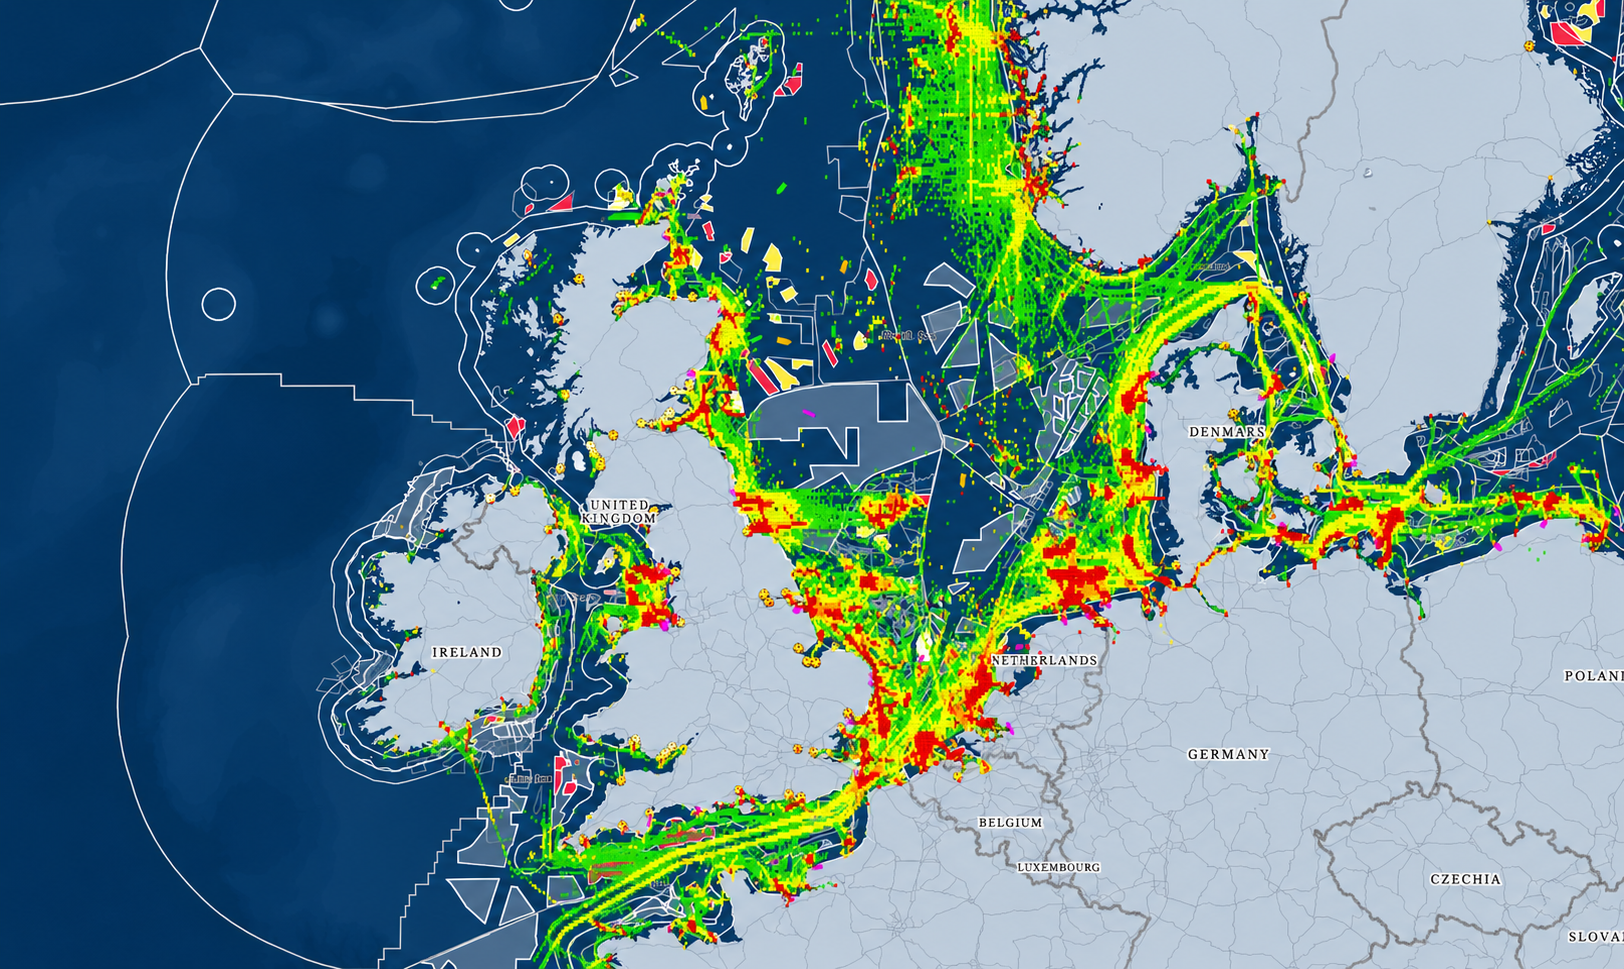
Offshore vessel movements can appear scattered when viewed in isolation. In reality, traffic around major wind projects is closely influenced by infrastructure, construction activity and project timelines.
By combining automatic identification system (AIS) records with geographic information system (GIS) analysis and development data, Nikhar Parikh, GIS Manager at TGS | 4C, shows how offshore wind farms can transform apparently random vessel movements into recognisable operational patterns. The case study focuses on Dogger Bank B, Dogger Bank C and Sofia.
Defining the right study area
Rather than analysing a broad section of the North Sea, which could include unrelated passing traffic, the study concentrated on three specific areas:
- Wind farm footprints
- A narrow ring around wind farm boundaries
- Corridors around export cables
This approach keeps the analysis closely linked to offshore infrastructure and reduces the risk of confusing project-related vessel movements with wider marine traffic.
Historical AIS records were then analysed over time. Within the wind farm footprints, summed AIS activity was relatively modest in 2021 and 2022, at 861 and 741 records respectively.
Activity increased to 1,947 records in 2023 before rising sharply to 10,369 in 2024 and 20,125 in 2025.
Counting vessels alone, however, does not explain why activity changes. GIS provides the spatial context needed to understand what is happening.
From surveys to construction
When AIS information is compared with project timelines, a clearer pattern emerges.
The project timeline moved from leasing and development agreements in 2020 through surveys, geotechnical investigation and monopile preparation, before offshore construction and cable installation began in 2023. By 2024, foundation installation and other offshore vessel operations had intensified, followed by turbine installation and sustained construction activity in 2025.
This progression is reflected in the vessel data.
During 2021 and 2022, traffic was comparatively light and consistent with survey work, enabling works and early preparation. These activities typically require specialist vessels operating intermittently rather than a sustained construction fleet.
From 2023 onwards, export cable installation, foundation work, offshore construction and substation activity produced a much denser operational footprint.
Infrastructure becomes a spatial organiser
By 2024 and 2025, vessel movements were increasingly concentrated around specific parts of the wind farms and export cable routes.
The change is particularly clear when the survey phase of 2021 to 2022 is compared with construction starting in 2023 and peak construction during 2024 to 2025. Vessel activity developed from relatively dispersed patterns into increasingly dense clusters and corridors around the infrastructure.
Parikh argues that this demonstrates an important characteristic of offshore wind farms: they do not simply occupy marine space. They actively organise activity around themselves.
Their influence can create:
- Operational hotspots around construction areas
- Repeated vessel movements along export cable corridors
- Concentrated activity around turbines and substations
- Changing patterns of vessel speed and repetition
This differs from a traditional offshore oil and gas platform, where activity may be concentrated around a single fixed point. A large wind farm distributes its influence across a much wider area.
Turning vessel data into project intelligence
The value of GIS is therefore not simply in producing maps. It comes from connecting separate datasets.
AIS provides the movement record, infrastructure layers provide the spatial framework and project timelines explain the development context. Together, they can show how offshore construction changes marine activity over time.
For developers, this can help interpret the progression of construction and installation campaigns. For planners and regulators, it can provide a clearer picture of how major developments alter vessel traffic in specific locations.
The Dogger Bank B, Dogger Bank C and Sofia case study demonstrates the relationship clearly. Early AIS activity corresponds with survey and preparatory work. From 2023, vessel activity rises sharply as construction intensifies, while the spatial patterns become increasingly shaped by the infrastructure itself.
Without GIS, AIS data is largely a collection of coordinates and timestamps. With the appropriate spatial and project context, it becomes evidence of how offshore wind development changes the use of marine space.
Read the complete case study from TGS | 4C on GIS, AIS data and the influence of offshore wind infrastructure on vessel traffic in PES Wind: https://pes.eu.com/exclusive-articles/how-offshore-infrastructure-shapes-vessel-traffic-a-gis-based-case-study








-1.jpg)
-1.jpg)