The Berlin-based company Valentin Software, which is well-known for its worldwide industry solutions, has adapted its market-leading design programs for photovoltaic systems, PV*SOL and PV*SOL premium, to the latest technical developments for 2019 and expanded them for the latest applications.
Valentin Software already presented its new products to the public in June 2018 at the world’s leading trade fair Intersolar Europe in Munich. With the new versions, system designers and operators can design their solar systems according to the latest findings, simulate accurate yield calculations under site-specific conditions and thus also perform accurate financial calculations, taking state support measures into account. This applies both to the adoption and input of geometric data to represent a 3D model as the basis for positioning the modules as well as the inclusion of complex parameters for detailed technical replication of the entire PV system. Replicating electrical consumers now includes the detailed input of electric vehicles, which can be divided into several groups.
For each group the user can determine the vehicle type, number and expected kilometers. The timings at the charging station can be set individually for each group on 7 days of the week.
When inputting the installation of the module array, 3D models can be imported via an interface, for example using photos from drone flights. This adds another important tool to the already existing possibility of importing floor plans, cadastral maps and screenshots from web-based satellite maps (e.g. Google Earth) directly into the 3D visualization and thus integrating them to scale into a project.
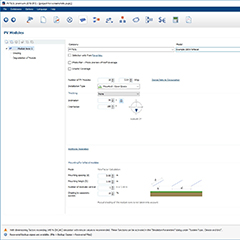
Another useful addition is the inclusion of the calculation of bifacial modules. After the automatic transfer of the necessary data from the 3D visualization, the irradiation is calculated for the backs of the mounted modules. The additional yield is shown separately in the energy balance.
Other helpful additions for optimizing a system are the output of the U-V characteristics for each time step of the simulation, as well as an energy flow diagram representing the overall system including the battery system and consumers, e.g. electric cars.


