
News
Published in: Solar, Press Releases
- Heatwaves, wildfires and atmospheric anomalies across major solar markets are highlighting the limitations of relying solely on historical weather data and standard performance benchmarks
- Solar irradiance varied significantly from long-term averages during summer 2026, with anomalies exceeding 30% in parts of Southeast Asia and the Western Pacific
- Solargis calls on solar investors and asset owners to stress-test portfolios against the latest resource data as El Niño intensifies shifts in global weather patterns
Bratislava, 21 September 2026 – Extreme weather conditions across major solar markets during summer 2026 are highlighting the limitations of relying solely on historical weather data and standard performance benchmarks to assess solar asset performance – according to a new global analysis from Solargis, the industry’s trusted source for solar data and software.
The analysis, which builds on findings from an earlier Solargis study into Europe’s sunnier climate, draws on global solar irradiance, temperature and precipitation anomaly data for June, July and August 2026. It provides a data-led assessment of how conditions across major solar markets compared with long-term seasonal averages.
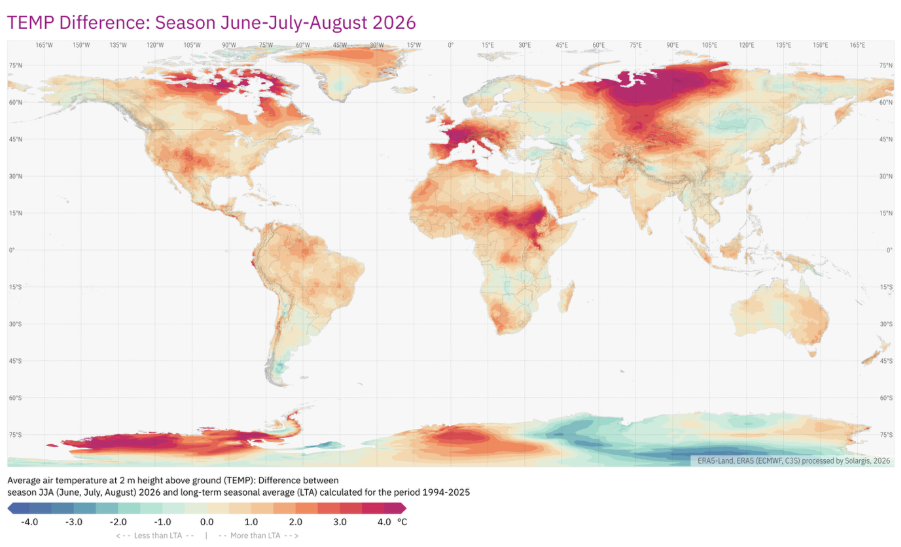
While parts of Western Europe and the Western Pacific experienced substantially higher-than-average irradiance, other major markets saw significant deficits. Summer 2026 also brought extreme heat in France, the central US and northern Canada, contributing to widespread wildfire activity, while China experienced Typhoon Dolphin, the strongest storm to make landfall in the country this year.
Against this backdrop, the developing El Niño could bring further shifts in temperature, cloud cover, precipitation and solar resource across global markets.
New key findings include:
- Western Europe: GHI more than 20% above average across southern England, Wales and Normandy.
- Northern Europe: GHI 5–25% below average across Scandinavia, Finland and Scotland.
- India: GHI 5–20% below average across several central and eastern states, while less monsoon-affected areas remained up to 20% above average.
- Southeast Asia and Western Pacific: some of the largest positive anomalies globally, with GHI locally more than 30% above average.
- South America: GHI more than 20% below average across the Paraná River Basin, northern Argentina, Uruguay and southern Brazil.
- Africa: regional variation ranging from more than 20% below average around the Gulf of Guinea to up to 20% above average in parts of Kenya and Ethiopia and 30% above average along eastern Madagascar.
- China: GHI 5–25% above average in the Sichuan Basin, while central China and Mongolia were generally 2–15% above average.
-1.png?width=901&height=424&name=image%20(1)-1.png)
For solar investors and asset owners, these variations can make it more difficult to distinguish weather-driven changes in generation from genuine asset underperformance. Where conditions depart significantly from those underpinning long-term expectations, current resource data is essential to understanding the drivers of measured performance.
“Summer 2026 has demonstrated the extent to which solar resource conditions can diverge from historical averages across major markets,” said Marcel Suri, CEO of Solargis. “For asset owners and investors, understanding the extent to which these variations are weather-driven is essential when assessing performance. Historical data remains fundamental to solar resource assessment, but it needs to be complemented by current, high-resolution resource information to provide an accurate picture of changing conditions.”
With El Niño continuing to develop, monitoring large-scale climate signals alongside high-resolution solar resource data is becoming increasingly important for understanding how global conditions may evolve.
As part of the analysis, Solargis is calling on solar investors, developers, asset owners and operators to stress-test portfolios against the latest solar resource and weather data, regularly assess performance and revisit long-term yield assumptions where significant deviations emerge.
To read the full analysis, please visit:
About Solargis:
Solargis is a data and software provider for bankable solar investments, providing solutions for all phases of solar energy projects, from initial planning and securing financing to daily operations, management, and maintenance.
Solargis works with solar stakeholders throughout the lifetime of their projects and portfolios, reducing risk and creating transparency with the most accurate and reliable solar data on the market.
Solargis data have helped develop 500+ GW of assets worldwide and are used for monitoring and forecasting of solar power plants with a combined capacity of 200+ GW.
To learn more: https://solargis.com/








%20is%20especially%20important%20for%20smart%20energy%20systems.jpg)

-Aug-21-2026-08-47-40-5283-AM.png)